
Here I am coming with real time challenge. Those who are interested can try this and test your knowledge.
This
is not expert level challenge. People are showing interest to solve
these challenges. So I am just posting intermediate level challenge.
See
below image:

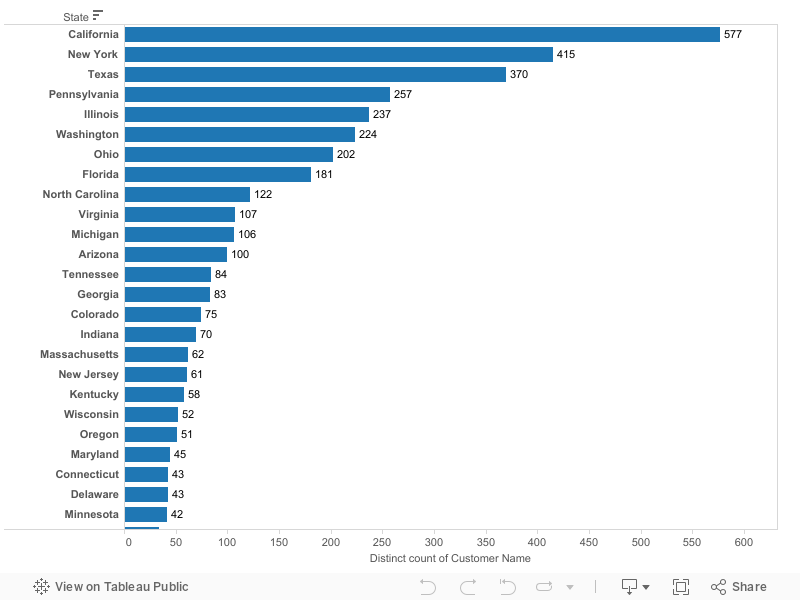
In
above chart I am showing % of unprofitable
Customers in each State.
For
example:
In
“Illinois” State 57%
of Customers has Profit
less than zero.
Lets
assume in “Illinois” State
100 Customers are there. In that
100 Customers, 57
Customers has Profit
less than zero.
To
Solve this challenge please download below workbook:
For more challenges: Click Here