


Tableau Desktop Advanced Course
1.
Functions
·
Number Functions
o ABS
o DIV
o EXP
o POWER
o ROUND
o SIGN
o SQRT
o SQUARE
·
String Functions
o ASCII
o CHAR
o CONTAINS
o ENDSWITH
o FIND
o LEFT
o LEN
o LOWER
o LTRIM
o MID
o REPLACE
o RIGHT
o RTRIM
o SPACE
o STARTWITH
o TRIM
o UPPER
·
Date
o DATEADD
o DATEDIFF
o DATENAME
o DATEPARSE
o DATEPART
o DATETRUNC
o DAY
o MONTH
o NOW
o TODAY
o YEAR
·
Type Conversion
o DATE
o DATETIME
o FLOAT
o INT
o MAKEDATETIME
o STR
·
Logical
o CASE
o IF
o IFNULL
o IIF
o ISDATE
o ISNULL
o ZN
·
Aggregate
o ATTR
o AVG
o COUNT
o COUNTD
o MAX
o MEDIAN
o MIN
o SUM
·
User
o FULLNAME
o ISFULLNAME
o ISMEMBEROF
o ISUSERNAME
o ISDOMAIN
o USERDOMAIN
o USERNAME
·
Table Calculation
o FIRST
o INDEX
o LAST
o LOOKUP
o PREVIOUS_VALUE
o RANK
o RANK_DENSE
o RANK_MODIFIED
o RANK_UNIQUE
o RUNNING_AVG
o RUNNING_COUNT
o RUNNING_MAX
o RUNNING_MIN
o RUNNING_SUM
o SIZE
o TOTAL
o WINDOW_AVG
o WINDOW_COUNT
o WINDOW_MAX
o WINDOW_MIN
o WINDOW_SUM
2.
Table Calculations
3.
Adding Reference Line Advanced
4.
Real Time Scenarios
·
Mapping
5 parameters to top 5 Quarters
·
Showing
latest 4 months or quarters dynamically
·
Gap
Analysis using floating bar chart
·
Weekly
sales by year. showing Week dates exactly on axis
·
Region
sales line graph, showing different shapes for connecting points
·
Dynamic
sorting for sales by month-year
·
Sorting
month-year sales based on current month
·
Showing
inventory for selected day if not selected then show last day inventory by
month wise
·
Actual
vs Plan sales graph with variance KPI
·
Showing
First day of year or month sales dynamically
·
sales
vs profit ratio at row level and grand total level
·
Upper/right
triangle matrix, Lower/left triangle matrix, Correlation Matrix table
·
Some
times you wont find synchronize axis option. why ? how to solve this?
·
Bar
Charts in Tool tip
·
Swapping
different measures using parameters
·
Conditional
labeling
·
Quarter
over quarter when quarters looking like 15Q1, 15Q2...
·
Year
over year when quarters are like this 15Q1, 15Q2...
·
Showing
last 4 quarters + current quarter when we have previous and future quarters.
·
YTD
and MTD calculations
·
Showing
Sum(sales) for pane with out repeating same value.
·
Dynamic
sets in tableau
·
How
to Make KPI donut Charts
·
Manually
Choosing the number of bins
·
Creating
Sheet selector
·
Dynamic
Annotations
·
Creating
empty extract
·
How
to create Calendar Heat Maps in Tableau
·
How
to Label the Top of Stacked Bars
5.
Advanced Dashboard Techniques
·
Advanced
formatting techniques
·
Vertical
vs Horizontal containers
·
Best
practices
·
Advanced
Dashboard Actions
6.
Tips and Tricks
7.
Miscellaneous Topics
·
How
to do performance recording
·
Adding
New Color Palette
·
Adding
New Shape Palette
8.
Tableau Desktop 9 New Features
9.
Tableau Desktop 9 LOD Calculations
10.
Certification Guidance And Sample Questions Discussion
suresh.n2008@gmail.com
suresh.n2008@gmail.com
Scenario 6 Showing Sum(sales) for pane with out repeating same value
Scenario
6:
Problem:
Showing Sum(sales) for pane with out repeating same value.
See
below:

In
above image I am showing sum(Sales)
for each customer segment by each
pane.
The
above scenario we can show in two different ways. But User want to
see like above only.
See
the other two ways below:


In
above image we are seeing sum(Sales)
values for each row. Same value is repeating for each row
in the pane.
But
user wants to see only one value per each pane. How
to do it?
Solution:
Its
very simple but since longtime I don’t know this.
Step
1: Create calculated field “window_sum”
using below formula.
if
last()=0 then window_sum(sum(Sales))
else
NULL
END
Step
2: Drag Customer Segment,
Region, Sales
and window_sum to row shelf.
Then go to show me and select first row first option. See
below

Then
it will create a text table like below

Step
3: Now right click on “window_sum”
column which is there in measure values shelf and go to
“Compute using” then select “Pane Down”. See
below

Step
4: Now you will see “Window_sum along
pane (Down)” column header in the report. Just right
click on that and select edit alias. Just give “sum(Sales)”
Finally
report look like below:
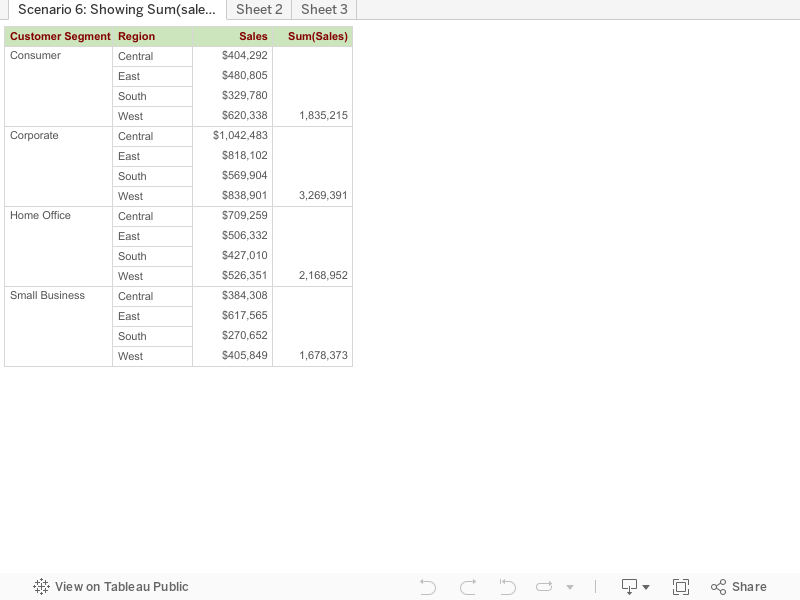
Tableau Desktop Fundamental Course
1. What is data visualization
2. Purpose of data visualization
3. Introduction to tableau
4. What is Tableau
5. Why Tableau
6. About Tableau products
·
Tableau
Desktop
·
Tableau
Server
·
Tableau
Public
·
Tableau
Online
·
Tableau
Reader
7. Installation of Tableau Desktop
8. Connecting to Excel Data source
9. Understanding of Data window
·
Dimension?
·
Measure?
·
Data
types and Symbols
10. Different ways of dragging dimensions
and measures
11. Sample report and dashboard
12. Connecting to data source
·
Connecting
to single table
·
Connecting
to multiple tables
·
Connecting
using custom SQL
·
Exporting
or saving data connection
·
Editing
data connection
·
Replacing
data connection
·
Refreshing
the connection
·
Extract
connection
·
Live
vs extract
·
Data
Source filters
·
switch
to live
·
Refreshing
extract
·
Closing
data source
·
Clipboard
data source
·
Data
Blending
13. Different File extension types in
Tableau
·
.tbm
·
.twb
·
.tde
·
.twbx
·
.tds
·
.tdsx
·
.tps
·
.tms
14. Tool bar menu icons
·
Undo
·
Redo
·
Save
·
Connect
to data
·
Create
new sheet or dashboard or story
·
Duplicate
sheet
·
Clearing
sheet
·
Swapping
·
Sorting
·
Labeling(abc)
·
Resetting
cards
·
Pinning
axis
·
Highlighting
·
Presentation
view
15. Data window options
·
Add
to sheet
·
Show
quick filter
·
Duplicate
·
Rename
·
Hide
·
Group
by folder or data source table
·
Create
folder
·
Change
data type
·
Change
Geo graphic role
·
Default
properties
·
Replace
references
·
Describe
·
Creating
calculation field
16. Cross tab reports
·
simple
cross tab report
·
cross
tab report with more than 6 columns
·
cross
tab report with more than 16 columns
·
showing
header for single measure cross tab report
·
hiding
and showing columns in cross tab report
·
adding
sub totals, row and column grand totals
·
formatting
cross tab reports
·
conditional
formatting in cross tab report
·
KPI
in cross tab reports
17. Hierarchies
·
Create
Hierarchies
·
Hierarchies
in cross tab reports
·
Hierarchies
in charts
18. Bar and Line charts
·
Simple
Bar chart
·
Side
by side Bar chart
·
Staked
Bar chart
·
Grouped
Bar chart
·
Bar
with line chart (Dual axis)
·
Bar
with in Bar chart (Dual axis)
·
About
marks shelves (Color, Size, Label, Tool Tip)
·
Annotations
(Mark, Point and Area)
·
Formatting
sheets
19. Worksheet options
·
Renaming
of sheet
·
Deleting
sheet
·
Duplicating
sheet
·
Duplicating
as cross tab
·
Export
sheet
·
Copy/Paste
formatting
·
Copy/Paste
sheets
·
Show
title, caption, summary options
·
Describing
sheet
20. Filters
·
Quick
filters
·
Filtering
Dimensions
·
Filtering
Measures
·
Range
filters
·
Context
filters
·
Filter
options
·
Applying
filter to specific sheets
·
Applying
filter to data source
·
Date
filters
·
Conditional
filters
·
Top
filters
·
Relevant
filters
21. Parameters
·
Create
parameter
·
Parameter
options
·
Sheet
selector using parameter
·
Selecting
measure using parameter
22. Sorting
·
Icon
Sorting
·
Sorting
options
·
Manual
sorting
·
Computed
sorting
23. Groups
·
Creating
Groups
·
Dynamic
Groups using calculated field
24. Sets
·
Creating
Set
·
Combined
Sets
·
Sets
in calculation field
25. Table calculations
·
Running
Total
·
Difference
·
Percent
Difference
·
Percent
of Total
·
Rank
·
Percentile
·
Moving
Average
·
YTD
Total
·
Compound
Growth Rate
·
Year
over Year Growth
·
YTD
Growth
26. Bins
·
Creating
Bins
·
Bin
size with parameters
·
Custom
Bins
27. Forecasting
·
Show
Forecast
·
Forecast
options
·
Describe
Forecast
28. Trend lines
·
Show
Trend lines
·
Edit
Trend lines
·
Describe
Trend lines
·
Describe
Trend model
29. Reference lines
·
Adding
reference line
·
Reference
line per cell, per pane, entire table
·
Adding
reference band
·
Formatting
·
Distribution
·
Box
Plot
30. Different types of charts in tableau
·
Highlight
Table
·
Heat
map
·
Tree
map
·
Maps
·
Pie
Chart
·
Scatter
Plot
·
Area
Chart
·
Babble
Chart
·
Word
Cloud
·
Gantt
Bar Chart
·
Bullet
Chart
·
Box
and whisker plot
31. Dashboards
·
Dashboard
design
·
Dashboard
size selection
·
Difference
between Normal, Fixed width, Fixed height and Entire view
·
Tiled
vs Floating
·
Dashboard
components (Horizontal, Vertical, Text, Image, Web page, Blank)
·
Managing
dashboards and sheets
·
Dashboard
Actions
·
Formatting
Dashboards