Scenario
1 (Medium)
Problem:
we need to map each parameters to corresponding quarter to
calculate estimated uplift sales.
Description:
Lets take sample
superstore subset data set. I am more interested to see top 5
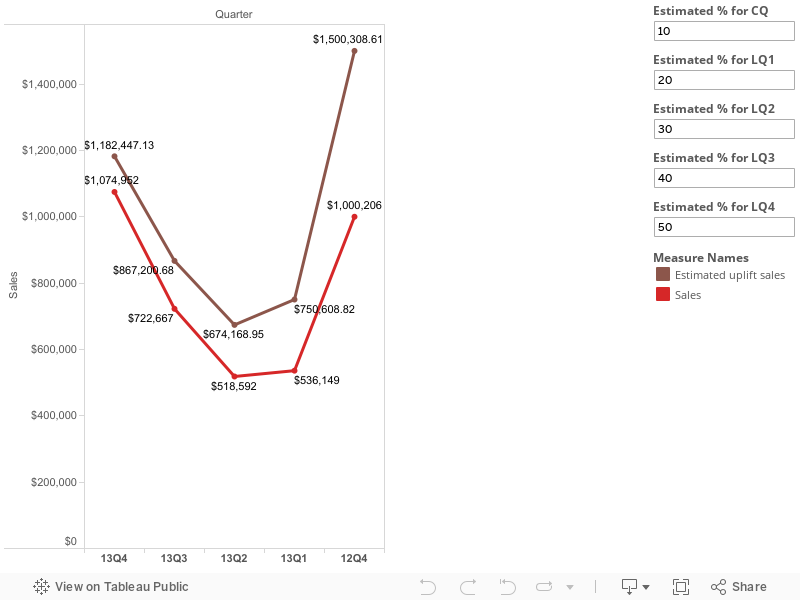
quarters of sales in my data set. I plot a line graph like below:

13Q4, 13Q3, 13Q2, 13Q1
and 12Q4 are my latest quarters in present dataset.
Note: assume
that 13Q4 as my current quarter and follows other as
13Q3 as LQ1
13Q2 as LQ2
13Q1 as LQ3
12Q4 as LQ4
Now I want to show one
more line with estimated % of increase in sales. I will pass
estimated % values for each Quarter using parameters.
My Parameters list:
Estimated % for
CQ
Estimated % for
LQ1
Estimated % for
LQ2
Estimated % for
LQ3
Estimated % for
LQ4
Now I need to calculate
Estimated sales for each quarter using following formula
if attr(quarter)
= '13Q4' then sum(sales)
+ (sum(sales)
* (Estimated % for CQ/100))
elseif attr(quarter)
= '13Q3' then sum(sales)
+ (sum(sales)
* (Estimated % for LQ1/100))
elseif attr(quarter)
= '13Q2' then sum(sales)
+ (sum(sales)
* (Estimated % for LQ2/100))
elseif attr(quarter)
= '13Q1' then sum(sales)
+ (sum(sales)
* (Estimated % for LQ3/100))
elseif attr(quarter)
= '12Q1' then sum(sales)
+ (sum(sales)
* (Estimated % for LQ4/100))
END
The above formula
should run for each row in the data set. But we cant hard code these
quarters like 13Q4, 13Q3 …...12Q1 because these data will come
dynamically from data source. In future you may see 14Q4,
14Q3....13Q1
Here
is the problem how to know which quarter is coming in current row? I
mean is CQ or LQ1 or LQ2 or LQ3 or LQ4?
Solution:
After
Knowing the solution you might feel simple. But this logic I got
after several trials.
First
create a 5 parameters with following names
Estimated % for
CQ
Estimated % for
LQ1
Estimated % for
LQ2
Estimated % for
LQ3
Estimated % for
LQ4
Just remember once
again the calculate field for Estimated uplift sales:
if attr(quarter)
= '13Q4' then sum(sales)
+ (sum(sales)
* (Estimated % for CQ/100))
elseif attr(quarter)
= '13Q3' then sum(sales)
+ (sum(sales)
* (Estimated % for LQ1/100))
elseif attr(quarter)
= '13Q2' then sum(sales)
+ (sum(sales)
* (Estimated % for LQ2/100))
elseif attr(quarter)
= '13Q1' then sum(sales)
+ (sum(sales)
* (Estimated % for LQ3/100))
elseif attr(quarter)
= '12Q1' then sum(sales)
+ (sum(sales)
* (Estimated % for LQ4/100))
END
In Above formula we
need to replace 13Q4,13Q3 …..12Q1 dynamically. Let think that if I
give positions for top 5 quarters as below
Top Quarter in data set
---> position as 1 and follows see below example
13Q4 ----> 1 and see
I can map this to CQ parameter
13Q3 ----> 2 this to
LQ1 parameter
13Q2 ----> 3 this to
LQ2 parameter
13Q1 ----> 4 this to
LQ3 parameter
12Q4 ----> 5 this to
LQ4 parameter
how to give
positions to Quarters?
Using rank function we
can give positions to quarters dynamically.
Create a calculate
field as “Rank Quarter” using below formula.
rank(attr([Quarter]))
now you will see like
this
this rank will update
for future quarters.

Now we will write
calculation field for Estimated uplift sales using Rank Quarter
field.
if [Rank
Quarter] = 1 then sum(Sales)
+ (sum(Sales)
* ([Estimated % for CQ]/100))
elseif [Rank
Quarter] = 2 then sum(Sales)
+ (sum(Sales)
* ([Estimated % for LQ1]/100))
elseif [Rank
Quarter] = 3 then sum(Sales)
+ (sum(Sales)
* ([Estimated % for LQ2]/100))
elseif [Rank
Quarter] = 4 then sum(Sales)
+ (sum(Sales)
* ([Estimated % for LQ3]/100))
elseif [Rank
Quarter] = 5 then sum(Sales)
+ (sum(Sales)
* ([Estimated % for LQ4]/100))
END
Now place the columns
in respective shelves and make a dual axis chart like below

Note:
I did not include two
things above.
1. calculation field to
extract “Quarter” column from “Order Date” column
right(str(year([Order
Date])),2) + 'Q' + str(datepart('quarter',[Order
Date]))
2. Applying top 5
filter on Quarter column to see top 5 quarters

See the report below: