1. What is data visualization
2. Purpose of data visualization
3. Introduction to tableau
4. What is Tableau
5. Why Tableau
6. About Tableau products
·
Tableau
Desktop
·
Tableau
Server
·
Tableau
Public
·
Tableau
Online
·
Tableau
Reader
7. Installation of Tableau Desktop
8. Connecting to Excel Data source
9. Understanding of Data window
·
Dimension?
·
Measure?
·
Data
types and Symbols
10. Different ways of dragging dimensions
and measures
11. Sample report and dashboard
12. Connecting to data source
·
Connecting
to single table
·
Connecting
to multiple tables
·
Connecting
using custom SQL
·
Exporting
or saving data connection
·
Editing
data connection
·
Replacing
data connection
·
Refreshing
the connection
·
Extract
connection
·
Live
vs extract
·
Data
Source filters
·
switch
to live
·
Refreshing
extract
·
Closing
data source
·
Clipboard
data source
·
Data
Blending
13. Different File extension types in
Tableau
·
.tbm
·
.twb
·
.tde
·
.twbx
·
.tds
·
.tdsx
·
.tps
·
.tms
14. Tool bar menu icons
·
Undo
·
Redo
·
Save
·
Connect
to data
·
Create
new sheet or dashboard or story
·
Duplicate
sheet
·
Clearing
sheet
·
Swapping
·
Sorting
·
Labeling(abc)
·
Resetting
cards
·
Pinning
axis
·
Highlighting
·
Presentation
view
15. Data window options
·
Add
to sheet
·
Show
quick filter
·
Duplicate
·
Rename
·
Hide
·
Group
by folder or data source table
·
Create
folder
·
Change
data type
·
Change
Geo graphic role
·
Default
properties
·
Replace
references
·
Describe
·
Creating
calculation field
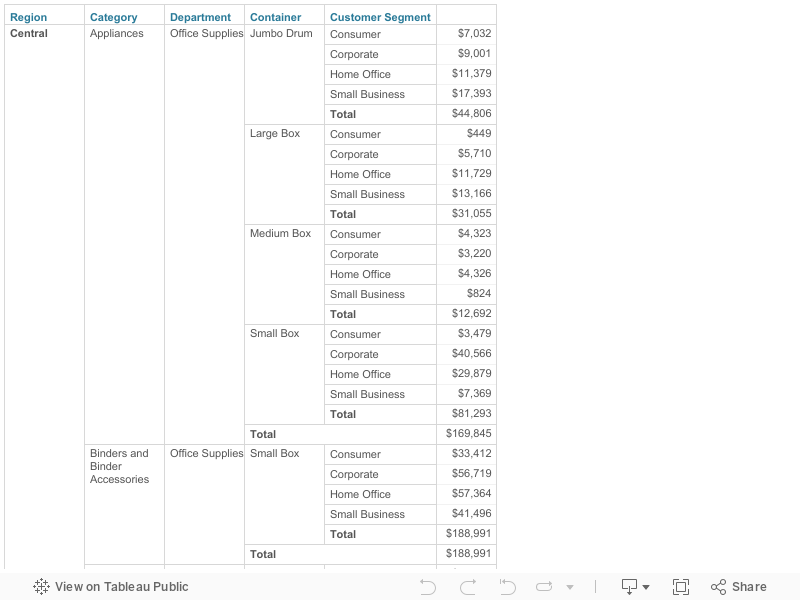
16. Cross tab reports
·
simple
cross tab report
·
cross
tab report with more than 6 columns
·
cross
tab report with more than 16 columns
·
showing
header for single measure cross tab report
·
hiding
and showing columns in cross tab report
·
adding
sub totals, row and column grand totals
·
formatting
cross tab reports
·
conditional
formatting in cross tab report
·
KPI
in cross tab reports
17. Hierarchies
·
Create
Hierarchies
·
Hierarchies
in cross tab reports
·
Hierarchies
in charts
18. Bar and Line charts
·
Simple
Bar chart
·
Side
by side Bar chart
·
Staked
Bar chart
·
Grouped
Bar chart
·
Bar
with line chart (Dual axis)
·
Bar
with in Bar chart (Dual axis)
·
About
marks shelves (Color, Size, Label, Tool Tip)
·
Annotations
(Mark, Point and Area)
·
Formatting
sheets
19. Worksheet options
·
Renaming
of sheet
·
Deleting
sheet
·
Duplicating
sheet
·
Duplicating
as cross tab
·
Export
sheet
·
Copy/Paste
formatting
·
Copy/Paste
sheets
·
Show
title, caption, summary options
·
Describing
sheet
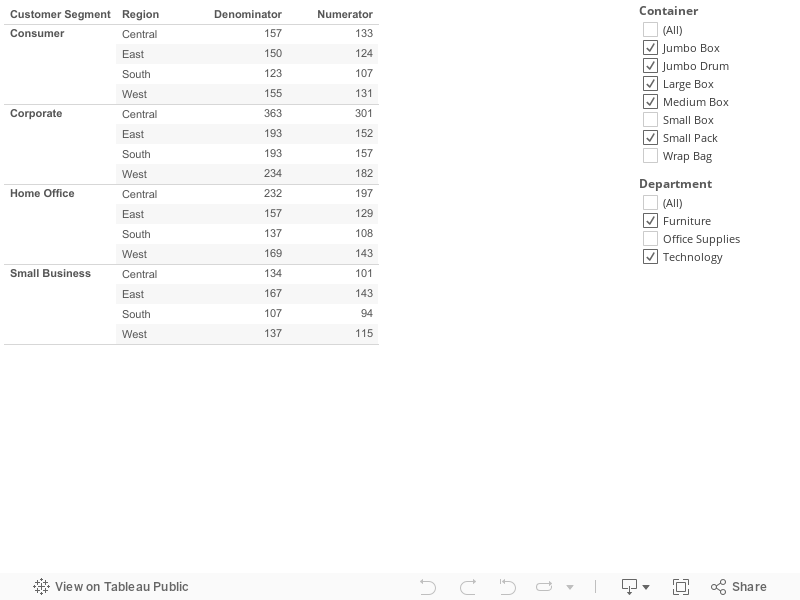
20. Filters
·
Quick
filters
·
Filtering
Dimensions
·
Filtering
Measures
·
Range
filters
·
Context
filters
·
Filter
options
·
Applying
filter to specific sheets
·
Applying
filter to data source
·
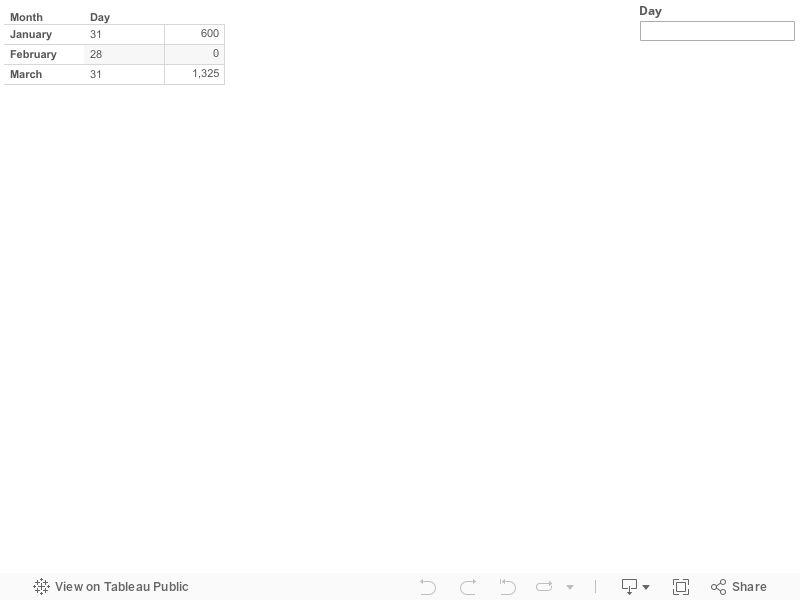
Date
filters
·
Conditional
filters
·
Top
filters
·
Relevant
filters
21. Parameters
·
Create
parameter
·
Parameter
options
·
Sheet
selector using parameter
·
Selecting
measure using parameter
22. Sorting
·
Icon
Sorting
·
Sorting
options
·
Manual
sorting
·
Computed
sorting
23. Groups
·
Creating
Groups
·
Dynamic
Groups using calculated field
24. Sets
·
Creating
Set
·
Combined
Sets
·
Sets
in calculation field
25. Table calculations
·
Running
Total
·
Difference
·
Percent
Difference
·
Percent
of Total
·
Rank
·
Percentile
·
Moving
Average
·
YTD
Total
·
Compound
Growth Rate
·
Year
over Year Growth
·
YTD
Growth
26. Bins
·
Creating
Bins
·
Bin
size with parameters
·
Custom
Bins
27. Forecasting
·
Show
Forecast
·
Forecast
options
·
Describe
Forecast
28. Trend lines
·
Show
Trend lines
·
Edit
Trend lines
·
Describe
Trend lines
·
Describe
Trend model
29. Reference lines
·
Adding
reference line
·
Reference
line per cell, per pane, entire table
·
Adding
reference band
·
Formatting
·
Distribution
·
Box
Plot
30. Different types of charts in tableau
·
Highlight
Table
·
Heat
map
·
Tree
map
·
Maps
·
Pie
Chart
·
Scatter
Plot
·
Area
Chart
·
Babble
Chart
·
Word
Cloud
·
Gantt
Bar Chart
·
Bullet
Chart
·
Box
and whisker plot
31. Dashboards
·
Dashboard
design
·
Dashboard
size selection
·
Difference
between Normal, Fixed width, Fixed height and Entire view
·
Tiled
vs Floating
·
Dashboard
components (Horizontal, Vertical, Text, Image, Web page, Blank)
·
Managing
dashboards and sheets
·
Dashboard
Actions
·
Formatting
Dashboards